Penetration Depth Analysis in Multi-Deck Blackjack and Resulting Player Edge Variations
Multi-deck blackjack environments rely on shoe penetration as a core variable that shapes how card distributions unfold across hands, and observers note that deeper cuts into the shoe often align with increased opportunities for players tracking high and low card ratios. Penetration rates describe the proportion of cards dealt before a reshuffle occurs, typically ranging from 50 to 85 percent in six-deck or eight-deck configurations common across North American and European floors. Research from academic sources indicates that each additional percentage point of penetration can shift the expected value calculations for advantage players by measurable margins when combined with running count systems.
Core Mechanics of Penetration in Multi-Deck Setups
Dealers cut the shuffled shoe at predetermined depths using a plastic insert card, and this cutoff point directly determines how many decks remain unseen during play. In an eight-deck game with 75 percent penetration, roughly six decks enter active distribution before the shuffle resets the count, whereas a 60 percent cutoff leaves more cards behind and compresses the window for extreme count swings. Data compiled by state regulatory bodies such as the Nevada Gaming Control Board shows consistent patterns where tables advertise deeper penetration during slower weekday shifts to maintain game speed while still complying with house protocols.
Those who have examined surveillance logs across multiple properties find that penetration rarely stays fixed throughout an operating day, because floor supervisors adjust cutoffs based on table fill rates and dealer rotation schedules. Higher penetration correlates with longer average rounds per shoe, which in turn allows true count values to climb higher in positive situations, since more low cards have already exited the shoe. Conversely, shallow penetration keeps the composition closer to the initial 52-card baseline for each deck and reduces the frequency of advantageous deviations from basic strategy.
Observed Correlations Between Penetration and Player Advantage
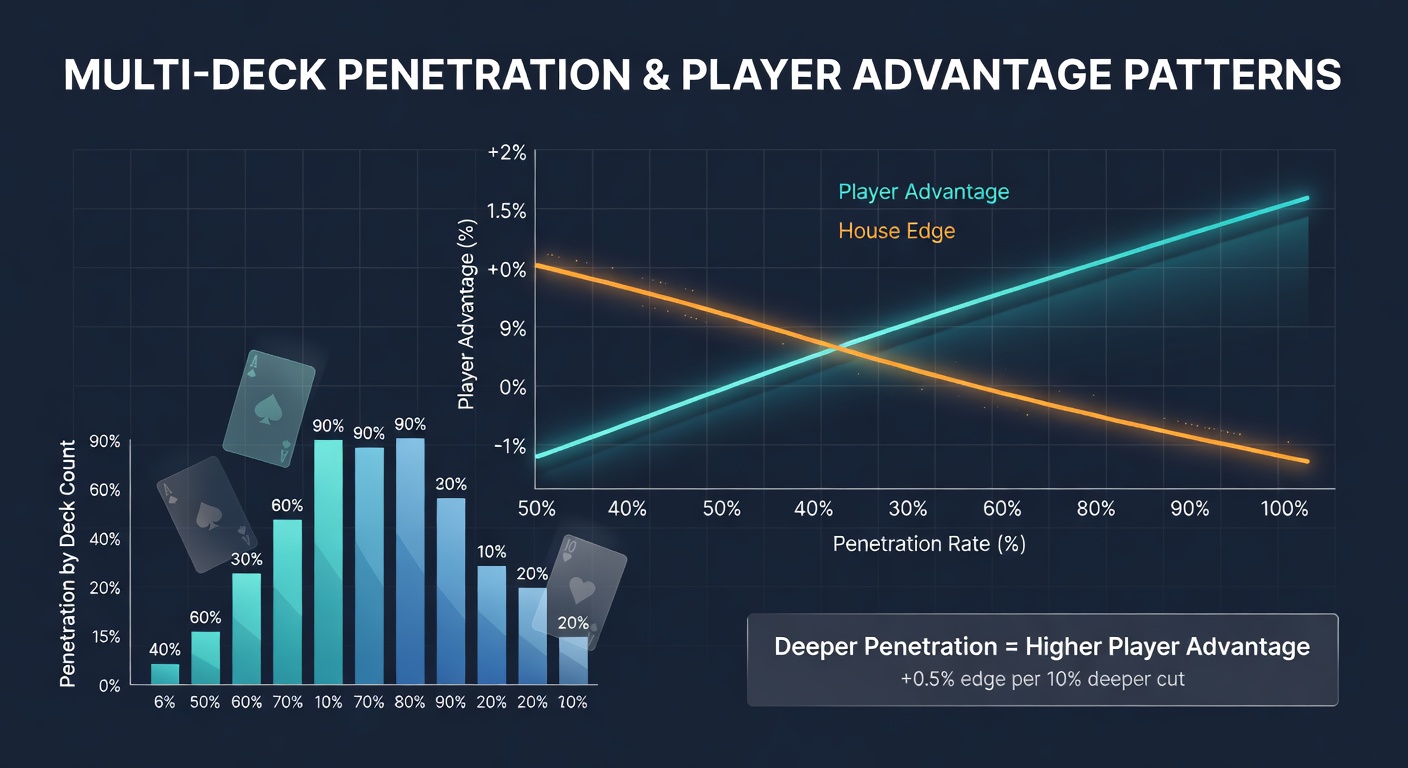
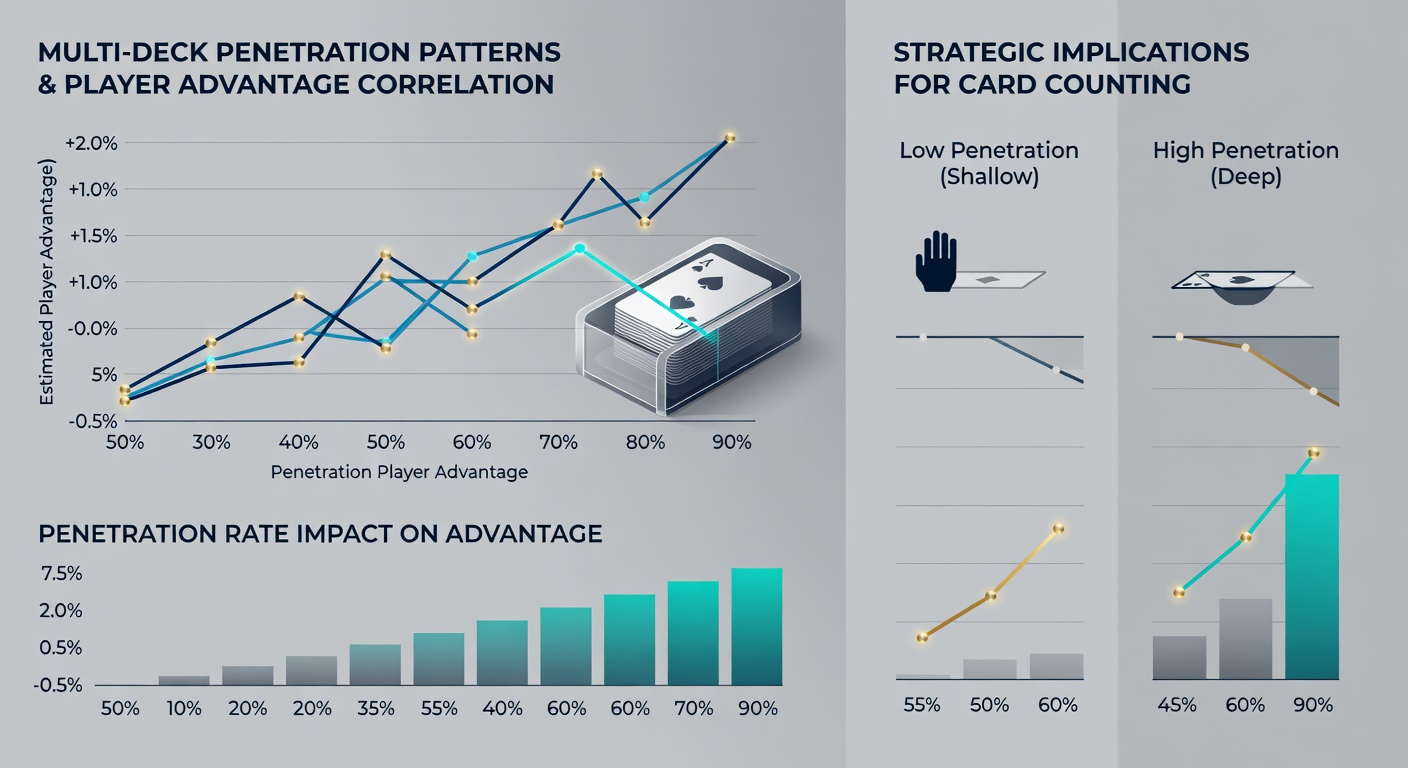
Statistical modeling of multi-deck outcomes demonstrates that player edge gains accelerate nonlinearly once penetration exceeds 70 percent in six-deck games. Simulations published in peer-reviewed gambling studies reveal that a one-deck increase in effective penetration can add between 0.2 and 0.5 percent to the overall return for a skilled counter using Hi-Lo or similar balanced systems, provided bet spreads remain within casino tolerance thresholds. These gains stem from the greater proportion of high cards remaining in the final third of the shoe, which elevates both blackjack frequency and double-down profitability.
Patterns emerge most clearly when comparing eight-deck tables with identical rules but differing cut depths. Properties that maintain 80 percent penetration report higher incidences of true counts reaching +3 or above in the later stages, whereas 65 percent penetration tables show count distributions clustered nearer to zero. Industry reports from Australian regulatory frameworks further confirm that penetration adjustments serve as a primary lever for controlling overall hold percentages without altering payout structures.
Regional and Operational Influences on Penetration Patterns
European casinos operating continuous shuffle machines alongside traditional shoes exhibit different penetration baselines than their North American counterparts, and analysts note that these machines effectively reset counts every few hands regardless of physical cut depth. In jurisdictions where manual shuffling remains standard, seasonal staffing levels in May 2026 have prompted some operators to shorten penetration slightly during peak tourist months to accelerate table turnover. Such adjustments create measurable dips in the frequency of high-edge opportunities, according to aggregated floor data reviewed by research institutions.
Player tracking of penetration occurs through direct observation of teh discard tray relative to remaining decks, and experienced counters factor this variable into real-time true count conversions. When penetration sits at 75 percent in a six-deck shoe, the same running count translates to a higher true count than it would at 60 percent because fewer unseen decks dilute the ratio. This relationship explains why certain venues advertise “deep shoe” promotions while simultaneously enforcing stricter table minimums to offset the statistical concession.
Measurement Challenges and Data Collection Practices
Accurate penetration assessment requires consistent methodologies across sessions, because minor variations in how the cut card sits within the shoe can alter effective depth by several cards. Researchers at specialized gaming laboratories employ video analysis and RFID-tagged decks to quantify these differences, producing datasets that link penetration metrics directly to hourly win-rate fluctuations. The resulting models show that variance in player results widens as penetration increases, reflecting the wider distribution of possible count outcomes toward the end of longer shoes.
Regulatory oversight in multiple jurisdictions mandates that penetration remain within published parameters, yet enforcement relies on periodic audits rather than continuous monitoring. Figures released by Canadian provincial gaming authorities illustrate that compliance rates exceed 95 percent, with violations typically resulting in temporary restrictions on advertised game speed rather than outright closures. These controls help stabilize the correlation between penetration and house hold while still permitting operators limited flexibility in daily operations.
Conclusion
Penetration rates function as a foundational parameter in multi-deck blackjack environments, directly modulating the magnitude and frequency of player advantage derived from card distribution tracking. Patterns documented across regulatory reports and academic analyses confirm that deeper cuts into the shoe expand the range of achievable edges, while shallower limits compress those opportunities toward the starting composition. Ongoing data collection from diverse jurisdictions continues to refine these relationships, providing operators and analysts with quantifiable benchmarks for game configuration decisions.