Bet Frequency and Risk Exposure Patterns in Craps and Roulette Tables
Logan Fischer · Aug 19, 2026
Bet Frequency and Risk Exposure Patterns in Craps and Roulette Tables
Bet frequency refers to how often players place wagers during a session while risk exposure measures the potential financial impact from those repeated actions across dice tables such as craps and wheel games including roulette; researchers have examined these elements together because higher placement rates tend to amplify variance even when individual bets carry similar house edges. Observers note that players at craps tables often place multiple bets per roll including pass line wagers combined with odds or place bets whereas roulette participants typically select inside or outside options once per spin creating distinct frequency profiles that data from casino operations links directly to session volatility levels.
Core Mechanics in Dice Tables
Craps involves a sequence of rolls where bet frequency rises when participants add proposition bets or hedge plays on each outcome and studies from gaming laboratories show that frequent additions such as field bets or hardways increase exposure because each new wager compounds the effect of short-term deviations from expected results; those who track session data find that players averaging eight to twelve bets per roll encounter wider swings in bankroll compared to those limiting activity to two or three core wagers like pass and come. The structure of the table encourages layering since multiple positions remain active simultaneously and figures from regulatory reports indicate that this layering correlates with elevated risk metrics when measured by standard deviation per hour of play.
Patterns Across Wheel Games
Roulette operates on discrete spins where bet frequency stays lower by design yet players can raise it through repeated straight-up selections or column bets and analysis from industry databases reveals that consistent placement on every spin elevates cumulative risk even with fixed house edges around 2.7 percent for European variants; data shows outside bets such as red-black or high-low allow slightly lower frequency because they resolve in larger groups while inside numbers demand more selections to maintain action levels. Wheel games therefore present a clearer separation between frequency and exposure since each spin resets all active positions and researchers have documented that sessions exceeding fifty spins with multiple chip placements per turn produce higher drawdown probabilities than slower paced approaches.
Mapping Frequency to Exposure Levels
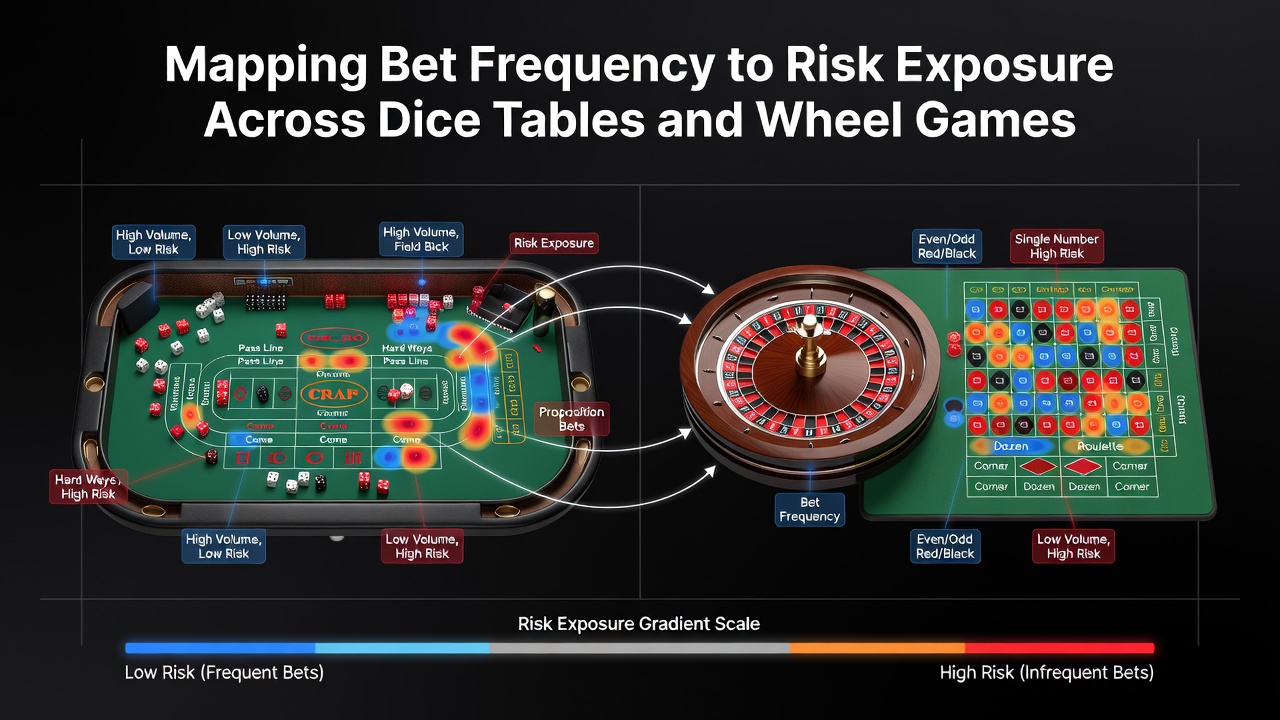
Mapping exercises combine frequency counts with risk indicators such as variance and maximum drawdown and one study from university gaming programs plotted craps sessions against roulette to demonstrate that dice tables generate steeper exposure curves once frequency crosses six bets per decision point; wheel game data points cluster differently because spin intervals create natural pauses that moderate cumulative exposure unless players accelerate placement rates through automated or rapid-fire methods. Those examining the maps observe clusters where moderate frequency paired with low-edge bets keeps exposure contained while high-frequency combinations push metrics into elevated zones regardless of game type. Turns out the relationship follows predictable mathematical paths since expected value calculations multiply across repeated trials and the resulting distributions widen as frequency rises.
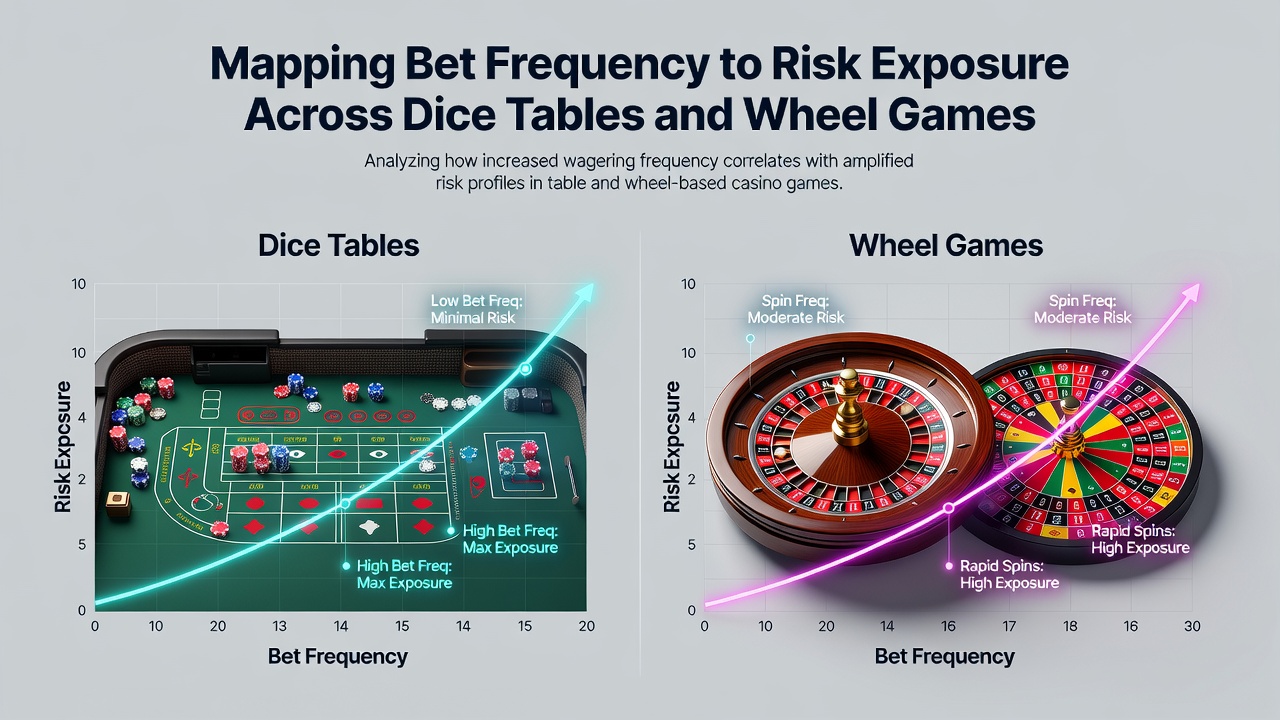
Further examination incorporates bankroll requirements where higher frequency demands larger reserves to absorb sequences of adverse outcomes and reports compiled by North American gaming associations highlight that craps participants maintaining eight or more active positions require reserves at least double those used in slower roulette play to reach equivalent survival rates through a fixed number of decisions. Australian regulatory summaries echo similar patterns when they compare electronic roulette terminals to live craps pits noting that terminal interfaces often facilitate higher placement rates and therefore greater measured exposure over equivalent time frames.
Data Sources and Observed Trends
According to records maintained by the Nevada Gaming Control Board average hold percentages remain stable across bet types yet session-level variance reports reveal clear frequency correlations when analysts segment players by action rate; comparable findings appear in Canadian provincial summaries where electronic table games allow precise logging of placement intervals and exposure calculations. Researchers continue to refine these maps by incorporating factors such as table minimums and maximums because those limits interact with frequency to shape overall risk profiles across both dice and wheel formats.
Conclusion
The relationship between bet frequency and risk exposure follows measurable patterns that emerge consistently in craps and roulette environments when frequency data is plotted against variance and drawdown statistics; continued collection of operational figures from multiple jurisdictions supports ongoing refinement of these mappings so operators and analysts can anticipate exposure levels based on observed placement rates rather than isolated bet selections alone.